“エクセルの表データをコピペするだけでブログ貼り付け可能なグラフを作る「ChartGizmo」”へのコメント4 つ
demon101: 2008-10-13 18:03
Hi,
You wrote:
JavaScriptでHTMLデータを生成するのですが、表示されないこともあるのが残念。
Capture creates JavaScript allowing to collect the data from Html of your page. To use this feature the source data table should be marked with “CSource” table class and the table columns should be marked with the “CLabels” and “CValues” classes. The table should precede the JavaScript.
I haven’t found the table on the page. That is why you have now data on the chart. =)
sigeo: 2008-10-13 19:07
Hi demon101.
I added a postscript this post.
Sorry, I don’t read caption closely.
Thanks!(^^)v
demon101: 2008-10-13 19:14
Hi,
Just for information: You can mark by class=”CLabels” class=”CValues” only in first row.
P.S. Capture API is too complicated for users, but i have no time for good description.
sigeo: 2008-10-13 19:43
Hi, demon101.
thanks. I modified “table”.
And I’ll try Capture API.

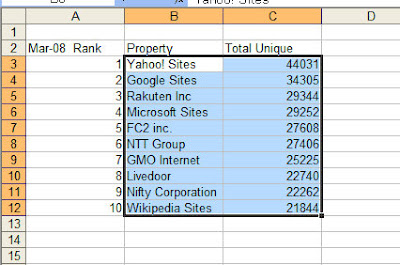
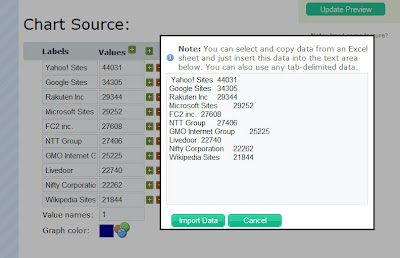
 実際にこのままコピーしてブラウザ上で貼り付けています。
 エクセルのデータをこのように貼り付けると、画像左のように自動的にグラフチャートのデータテーブルが追加されます。